- Home

- Monitoring
- Research
- Indicators
Indicators
Tanzania Forest Indicators
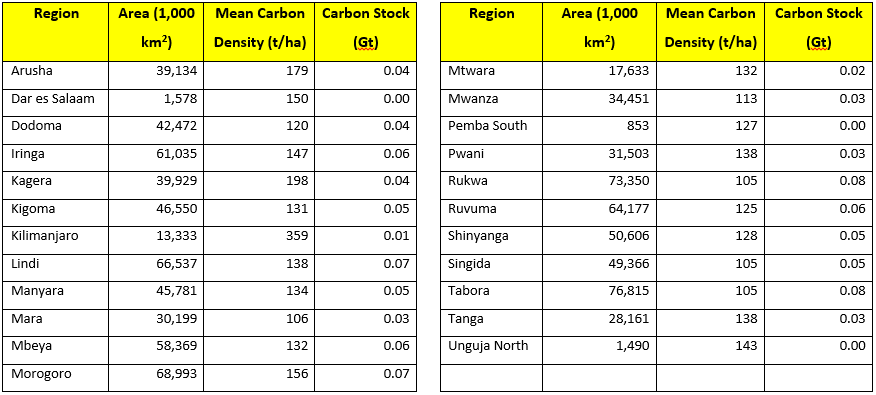
Carbon Density and Stock
Drivers of Deforestation and Degradation
Drivers of Deforestation and Degradation
Who is Monitoring
Monitored by Ministry of Agriculture, Ministry of Planning, Economy and Empowerment (Monitoring of National Strategy for Growth and Reduction of Poverty – NSGRP, also known as MKUKUTA)
How is it Monitored
- Crop productivity aggregated at four governance levels: village, district, regional and national
- Shifting arable land with changes in temperature and precipitation as detailed in the National Investment Centre (NIC) and NAPA documents
- Changes in cropping patterns (mono-crop vs. mixed) farming, timing (earlier or later), crop types, seed varietiesfertilizers, pesticides and herbicides
- Percentage change in food crop production Ministry of Agriculture and Food Security (MAFS)
- Percentage of smallholders using modern methods of farming (irrigation, fertilizers and improved seeds) National Bureau of Statistics (NBS)
- Percentage of households whose main income is derivfrom harvesting, processing and marketing of natural resources products National Bureau of Statistics (NBS) or Ministry of Natural Resources and
- Percentage of smallholders who have one or more off-farm income generating activities National Burea of Statistics
- Percentage of smallholders who accessed formal credits for agricultural purpose (NBS)
Who is Monitoring
Tanzania Forest Services and National Bureau of Statistics HBS/National Census
How is it Monitored
- Revenues from sale of forest products
- Information related to illegal activities and changes in forest utilization
- Percentage change in proportion of rural households reliance on forest products
- Adoption of alternative livelihood activities
Who is Monitoring
Ministry of Planning, Economy and Empowerment, Ministry of Energy and Tanzania Forest Service
How is it Monitored
- Percentage increase in number of customers connected to the national grid and off-grid sources of electricity Ministry of Energy and Minerals (MEM), National/Stations
- Percentage of households in rural and urban areas using alternative sources of energy to wood fuel (including charcoal) as their main source for cooking NBS
- Energy generation capacity by source (hydro, wind, solar, gas)
- Percentage of population connected to the national grid
- National energy generation capacity
- Number of projects/programs on alternative energy sources
- Proportion of households dependent on forests for energy resources
Who is Monitoring
Tanzania Forest Service
How is it Monitored
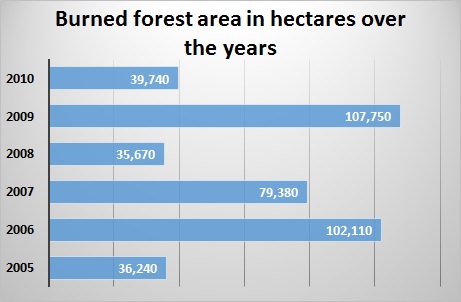
- Hectares of land under forest fire annually
Roads generally result in increased deforestation and degradation (Nepstad et al. 2001). They make the transport of goods possible and economically viable, linking resources and producers to markets at lower costs
A large proportion of the population depends on forests in some way for their livelihoods or for their fuelwood, this consequently puts pressure on forests and land
Source: Adapted from Excellensia Consulting (2010)
Ecosystem Types
Ecosystem Types
|
Ecosystem type |
Main regions |
|
Acacia savanna |
Shinyanga, Singida |
|
Coastal forest |
Lindi, Mtwara, Pwani |
|
Eastern Arc/montane forest |
Iringa, Morogoro, Tanga |
|
Guinea-Congo |
Kagera, Mwanza |
|
Miombo woodland |
Manyara, Morogoro, Tabora |
|
Miombo woodland |
Iringa, Morogoro, Tabora |
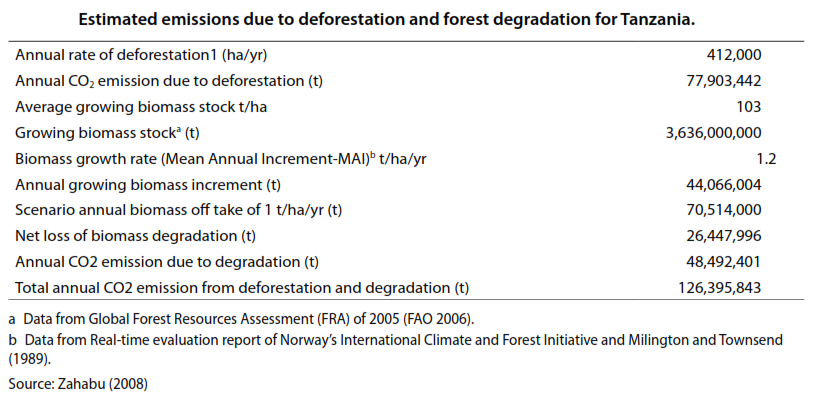
Estimated emissions
Estimated emissions
Forest Change Statistics
Forest Change Statistics
Forest change statistics (2002 – 2013) for Tanzania Mainland
|
No. |
Change class |
Area (x 1,000 ha) |
Annual loss (ha/yr) |
|
1 |
Forest |
32,000.9 |
|
|
2 |
Deforestation |
6,406.70 |
582,427.27 |
|
3 |
Non forest |
47,595.3 |
|
|
4 |
Wetland |
4,506.9 |
|
|
5 |
Water |
1,697.3 |
|
|
6 |
No data (clouds/shadow) |
304.9 |
|
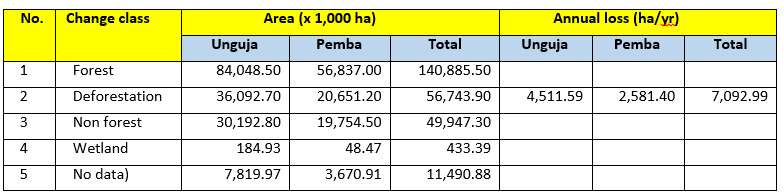
Forest change statistics (2004 – 2012) for Zanzibar Island
Forest Cover Types
Forest Cover Types
|
Vegetation Type |
Eastern |
Southern |
S. Highlands |
Central |
Lake |
Western |
Northern |
|
Forest: Humid montane (ha) |
274,823 |
70,169 |
175,622 |
38,544 |
194,815 |
24,023 |
418,916 |
|
Forest: Lowland (ha) |
681,772 |
610,118 |
65,340 |
2,802 |
16,924 |
240,331 |
91,141 |
|
Forest: Mangrove (ha) |
153,423 |
37,899 |
- |
132 |
- |
68 |
2,081 |
|
Forest: Plantation (ha) |
16,180 |
3,095 |
558,227 |
2,559 |
85,427 |
10,533 |
44,605 |
|
Woodland: Closed (> 40%) |
1,822,100 |
1,847,086 |
838,212 |
763,517 |
537,505 |
1,869,029 |
363,751 |
|
Woodland: Open (10-40%) |
5,045,878 |
8,140,873 |
8,707,824 |
2,945,331 |
2,843,421 |
4,896,585 |
3,517,603 |
|
Forest and woodland total |
7,994,176 |
10,709,239 |
10,345,226 |
3,752,886 |
3,678,091 |
7,040,570 |
4,438,097 |
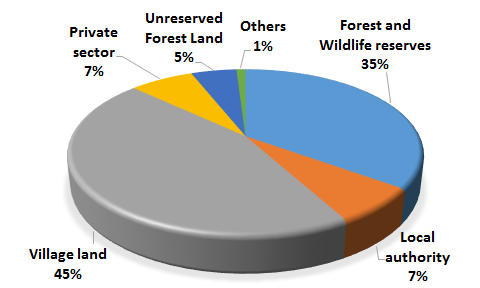
Forest Ownership
Forest Ownership
People and Economy
People and Economy
(a) Employment
7,000 people are directly employed by the forestry sector, according to 2011 FAO data.
(b) Economic Value
The forestry sector contributed USD 612.9 million to the economy in 2011, which is approximately 2.7% of the GDP.
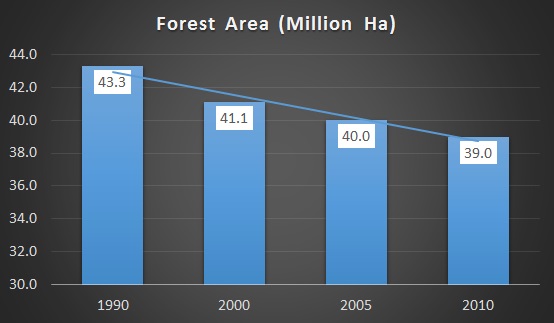
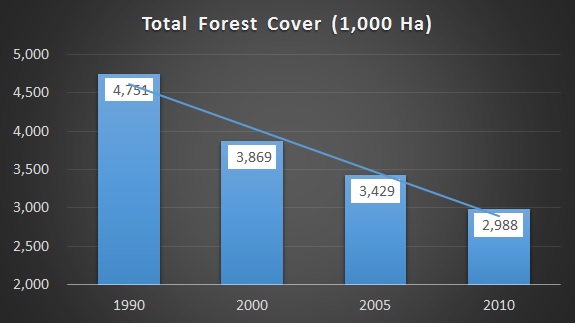
Total Forest Cover
Total Forest Cover
Trends in forest change from 1990 to 2010 showing an average loss of 403,328 ha per year
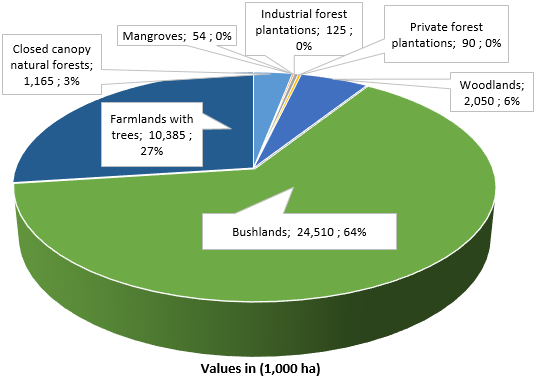
Total Forested Land
Total Forested Land
Forests include
- Montane
- Lowland
- Mangrove
- Plantation Forest
Woodland include
- Open and Closed Woodlands
- Thickets
Woodlands occupy 93% of total forested land
Mozambique Forest Indicators
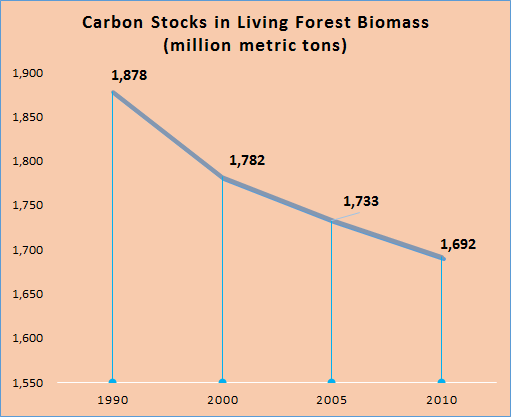
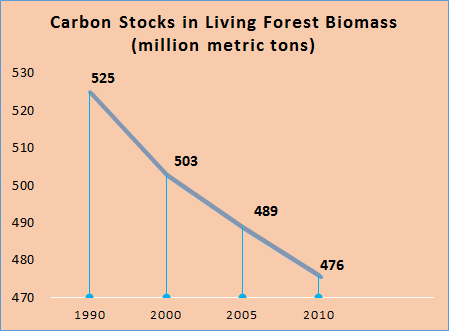
Carbon Stocks
Carbon Stocks
Drivers of Deforestation and Degradation
Drivers of Deforestation and Degradation
Agents and Indirect Causes
- Increased demand for agricultural products (tobacco, cotton, soybeans)
- Infrastructure expanding
- Political factors
Main degradation activities
- Selective wood cutting
- Firewood collection
- Hunting
- Pastures
- Fires
Main deforestation activities
- Large-scale production of sugarcane. producing vegetables, corn, soybeans, bananas
- Small scale agriculture in a Outgrowing-system cotton, cashew, tobacco
Results
- Deforestation for establishing the commercial agriculture and forest degradation
Agents and Indirect Causes
- Population Growth
- Increased domestic Demand for agricultural product
- Technological Development
Main degradation activities
- Selective wood cutting
- Firewood collection
- Hunting
- Pastures
- Fires
Main deforestation activities
- Shifting cultivation
- Yield crops
- Residential Areas
Results
- Deforestation for itinerant agriculture and Forest Degradation
Agents and Indirect Causes
- The increasing international demand for wood and its derivatives
- Political factors and governance
- Population growth
Main degradation activities
- Illegal logging
- Firewood collection
- Selective cutting
Main deforestation activities
- Forest concessions (native wood)
- Forest Plantations
Results
- Deforestation for or extraction of timber and products derivates and Forest Degradation
Agents and Indirect Causes
- Population Growth
- Infrastructure expansion
- Increased energy needs
Main degradation activities
- Firewood collection
- Coal Production
- Collection
Main deforestation activities
- Firewood collection and unsustainable charcoal production
- Expansion of housing and infrastructure areas
Results
- Deforestation by accumulation of impact over time collecting firewood and charcoal production and Forest Degradation
Agents and Indirect Causes
- Population Growth
- Economic Factors
- Migration urban rural areas
- Tourism
- Political Factors
Main degradation activities
Main deforestation activities
- Infrastructure expansion (eg roads, housing, tourist accommodation)
- Industry expanding
Results
- Deforestation for establishing urban Forest Degradation
Agents and Indirect Causes
- Increasing international demands for minerals
- Job search/migration
Main degradation activities
Main deforestation activities
- Mineral extraction
- Settlements in residential areas
- Infrastructure for exploration and flow
Results
- Deforestation related to mineral extraction Forest Degradation
Agents and Indirect Causes
- Standard increase in the local population consumption
- Animal products for domestic consumption
- Technological Development
Main degradation activities
- Pastures of small scale and in wooded areas
- Firewood Production
- Hunting
- Fires
Main deforestation activities
- Extensive grazing of cattle
Results
- Deforestation r elated to the creation of cattle, goats, swine, birds and Forest Degradation
Ecosystem Types
Ecosystem Types
|
Ecosystem type |
Provinces |
|
Mopane Forest
|
Gaza, Tete, Northern of Sofala & Manica Province |
|
Mecrusse Forest |
Inhambane, Gaza, Nampula & Sofala |
|
Mountainous Forest |
Zambezia, Mania & Niassa |
|
Mangoves Forest |
Along the wetlands of Coastal Area |
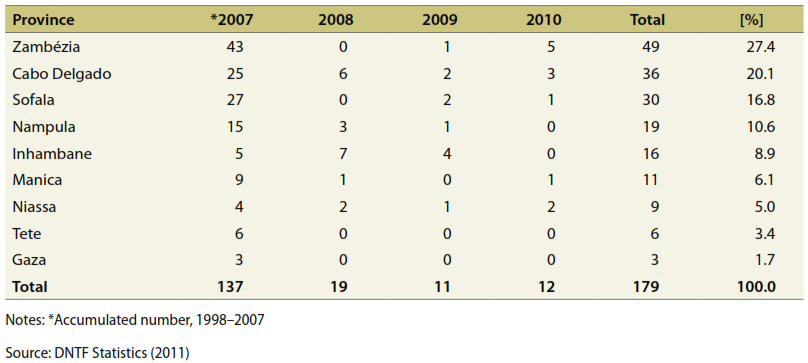
Forest Concessions Issued
Forest Concessions Issued
Number of forest concessions issued per year, 1998–2010
Forest classification based on usage
Forest classification based on usage
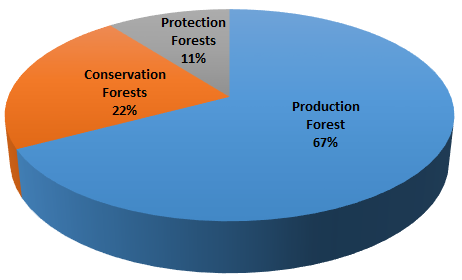
- Production Forests: 26.9 million ha
- Conservation Forests: 8.9 million ha
- Protection Forests: 4.2 million ha
People and Economy
People and Economy
(a) Employment
22 thousand people are directly employed by the forestry sector, according to 2011 FAO data.
(b) Economic Value
The forestry sector contributed USD 330.3 million to the economy in 2011, which is appoximately 2.8% of the GDP.
(c) Types of taxes by logging companies, annual revenues from 2012-2016
|
|
2012 |
2013 |
2014 |
2015 |
2016 |
|
Total in Mts
|
319.024.593
|
468.506446
|
572.970.033
|
347.057.986
|
446.037.024
|
|
Total in USD
|
4.519.402,08
|
6.637.008,73
|
8.116.872,54
|
4.916.531,89
|
6.318.699,87
|
Conversion rate USD$ 1 = 70.59 Mts
Statistics Derived from Forest Cover Map of 2007
Statistics Derived from Forest Cover Map of 2007
|
Province |
Total Area [km²] |
Closed Forest Area |
Open Forest Area |
Agriculture w/trees Area |
Shifting Cultivation Area |
|
Manica |
62,200 |
16,021.60 |
18,538.80 |
4,075.50 |
11784,3 |
|
Maputo |
26,964 |
2,986.60 |
5,164.20 |
|
|
|
Cabo Degaldo |
76,820 |
32,953.20 |
14,582.00 |
4,312.60 |
6633,5 |
|
Gaza |
77,040 |
16,959.80 |
20,749.40 |
18,309.50 |
1847,9 |
|
Nampula |
|
18,280.40 |
8,630.10 |
3,752.50 |
5074,8 |
|
Niassa |
127,760 |
57,865.10 |
363415.3 |
6403.6 |
3,430.90 |
|
Sofala |
68,712 |
8,538.30 |
19,958.50 |
7,791.30 |
9,373.20 |
|
Tete |
100,088 |
19,659.10 |
22,407.70 |
18,798.00 |
5,428.60 |
|
Inhambane |
67,260 |
10,999.40 |
12,057.30 |
16,466.50 |
8,566.30 |
|
Zambesia |
101,284 |
43,011.40 |
5,467.10 |
8,089.10 |
15,369.50 |
|
Total |
|
227,274.80 |
163,900.30 |
87,998.60 |
67,509.00 |
Timber Production
Timber Production
|
Product Type |
Unit |
2010 |
2011 |
2012 |
2013 |
2014 |
2015 |
Total |
Main Destination |
|
Logs |
m3 |
22,846 |
35,426 |
41,543 |
54,296 |
147,517 |
148,093 |
449,721 |
China |
|
Sawn Wood |
m3 |
175,491.52 |
175,982 |
218,842 |
226,500 |
373,769 |
272,858 |
1,443,443 |
China, UK |
|
Parquet (m3) |
m2 |
542.25 |
109 |
49 |
15 |
169 |
1,891 |
2,776 |
China, South Africa, UK |
|
Veneer (m2) |
m2 |
119.09 |
102 |
79 |
81 |
129 |
97 |
607 |
China |
|
Sleepers (m3) |
m3 |
1,041.37 |
1,657 |
1,998 |
1,062 |
1,092 |
806 |
7,655 |
China, South Africa, Malawi |
|
Wood panels |
- |
- |
36 |
55 |
9 |
20 |
120 |
China |
|
|
Bamboo |
st |
- |
- |
307 |
- |
- |
- |
307 |
China |
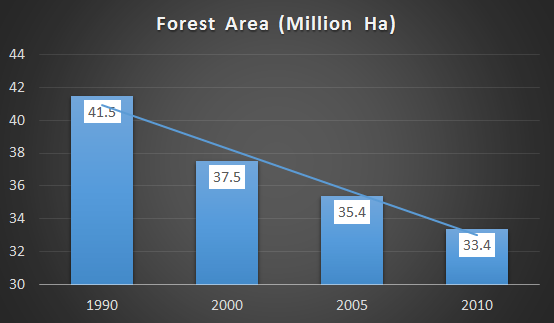
Total Forest Cover
Total Forest Cover
Between 1990 and 2010 Mozambique lost 10.0% of its forest cover, around 4,356,000 ha, whereby the average loss per year is 217,800 ha.
Uganda Forest Indicators
Burned Forest
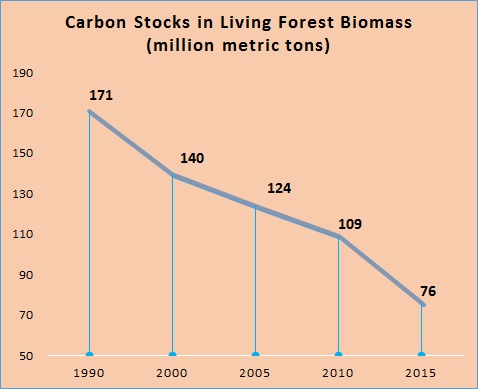
Carbon Stocks
Carbon Stocks
Drivers of Deforestation and Degradation
Drivers of Deforestation and Degradation
Source: REDD+ Readiness Preparation for Uganda Report
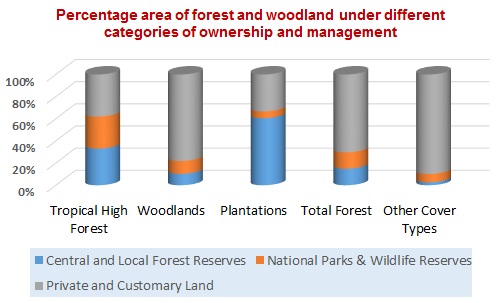
Forest Ownership and Management
Forest Ownership and Management
People and Economy
People and Economy
(a) Employment
12,000 people are directly employed by the forestry sector, according to 2011 FAO data.
(b) Economic Value
The forestry sector contributed USD 589.9 million to the economy in 2011, which is approximately 3.4% of the GDP.
Total Forest Cover
Total Forest Cover
Trends in forest change from 1990 to 2010
Kenya Forest Indicators
Carbon Stocks
Carbon Stocks
Comparison of public and community/private forests
Comparison of public and community/private forests
Most of the forest land in Kenya is under community and private ownership (77%) while the rest are under public (23%). Private plantations cover 47% of the total forest plantation area, which is almost equal to the area of stocked plantations under public management (53%)

Drivers of Deforestation and Degradation
Drivers of Deforestation and Degradation
Direct Drivers
- Inadequate application of basic silvicultural and ecological principles for forest management
- Tragedy of the commons resulting in conflicts over natural resources
Indirect Drivers
- Inadequate integration of the forest sector with other stakeholders
- Unclear forest responsibilities and weak conflict-management capacity
- Weak forest governance and institutions
- Corruption, illegal logging, weak enforcement
- Inadequate benefit sharing from forest resources
- Diverse perceptions of importance of forests
- Communal land tenure systems and their application
- Lack of private ownership, unclear tenure and access to forest resources
Direct Drivers
- Overgrazing and inadequate regulation of grazing in forest reserves and community lands
Indirect Drivers
- More focus shifted to water towers, paying less attention to dryland woodlands, including the coastal and riparian forests
Direct Drivers
- Clearing of forest for agriculture
- Degradation of forest
- Charcoal and fuel wood from unsustainable production
- Infrastructure and urbanisation
- Conversion of communal forest to agriculture
- Mining within forest areas
- Illegal logging
Indirect Drivers
- Demand is higher than supply
- Heavy bureaucracy and poor efficiency obstructing competitiveness
- Limited knowledge of tree growing (and necessary silviculture) as an enterprise
- Poverty, high prices for agriculture products, subsidised fertiliser, tax exemption for certain agricultural machinery resulting in unhealthy competition for land
- Fixed timber prices at low levels
- Rapidly increasing population has heightened the demand for land
- Few or no livelihood options have created over dependence on agriculture and mounting pressure on forest lands
Direct Drivers
- Poor uptake of new technologies
- Poor awareness of deforestation impacts
- Poor knowledge of tree planting
Indirect Drivers
- Uncertain availability of timber and wood for processing enterprises
- Low investment in wood processing resulting in ineffective processing
Direct Drivers
- Unsustainable utilisation, including overgrazing
- Conflict at multiple levels
- Fires are deliber ate, accidental, poorly managed and they destroy forests
- Wildlife damage impacting regeneration
Indirect Drivers
- Traditional farming methods in a context of increased population and overstocking of animals
Source: National Forest Programme 2016 - 2030
Ecosystem Types
Ecosystem Types
|
Ecosystem type |
Main regions |
|
High mountains |
Elgon, Kenya, Aberdares, |
|
Western plateau |
Kabarnet, Kakamega, Nandi |
|
Northern mountains |
Ndotos, Mathews, Leroghi, Kulal |
|
Coastal forests: |
Arabuko-Sokoke, Tana, Kayas, |
|
Southern hills |
Taita Hills, Kasigau, Shimba Hills, |
|
Riverine forests |
Tana and tributaries, Ewaso-Ngiro, |
Forest Estates
Forest Estates
Land use area changes in Kenya
Land use area changes in Kenya
|
Land use |
1990 |
2000 |
2005 |
2010 |
2015 |
|
Forest land |
4,724 |
3557 |
4,047 |
4230 |
4413 |
|
Crop land |
9,258 |
9661 |
9,868 |
10072 |
10276 |
|
Grassland |
41,522 |
41654 |
41,496 |
41080 |
40664 |
|
Settlement |
57 |
87 |
109 |
126 |
143 |
|
Other lands |
1,004 |
1574 |
1,035 |
1044 |
1053 |
|
Wetlands |
1,472 |
1504 |
1,482 |
1485 |
1488 |
|
Total area |
58,037 |
58,037 |
58,037 |
58,037 |
58,037 |
People and Economy
People and Economy
(a) Employment
18,000 people are directly employed by the forestry sector, according to 2011 FAO data.
(b) Economic Value
The forestry sector contributed USD 365.1 million to the economy in 2011, which is approximately 1.2% of the GDP.
Statistics of Saw Mill and Plywood Industries
Statistics of Saw Mill and Plywood Industries
The demand for building construction, furnishing and other end uses for forest products have grown faster than the supply from Kenya’s forests, resulting in an increase in net imports. The two main direct value addition industries from wood from Kenya’s forests are saw mills and plywood industries
|
Industry |
Number (2010) |
Capacity (2010) ('000m3) |
Consumption (2010) ('000m3) |
Demand (2020) ('000m3) |
|
Saw |
850 |
1000 |
855 |
1170 |
|
Plywood |
4 |
95 |
80 |
118 |
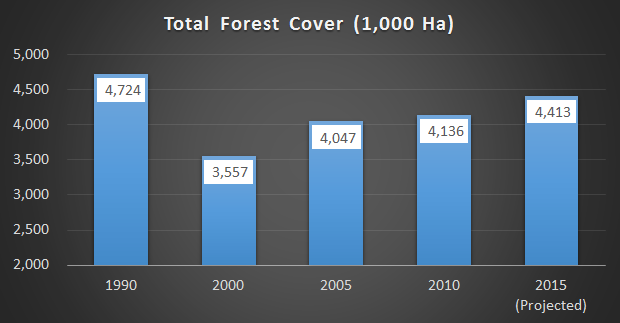
Total Forest Cover
Total Forest Cover
Between 1990 and 2000, Kenya lost approximately 1.2 million ha of forest land, equivalent to 25% of forest cover.
Quick Links
- National Strategies
- National Forest Reports
- Publications
- National Focal Points
- Laws and Policies
- Site Map
- Sign in / Sign Out
Share on
Funded By
OFESA’s activities are possible thanks to the support of the European Union

Project Implementers
OFESA is jointly implemented by CIFOR and RCMRD