Kenya Forest Indicators
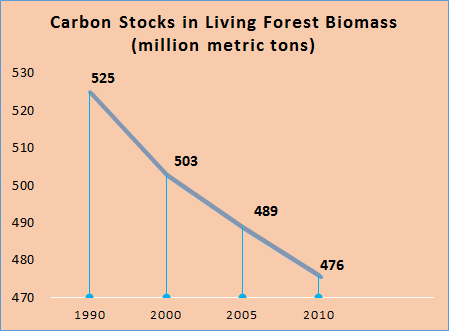
Carbon Stocks
Carbon Stocks
Comparison of public and community/private forests
Comparison of public and community/private forests
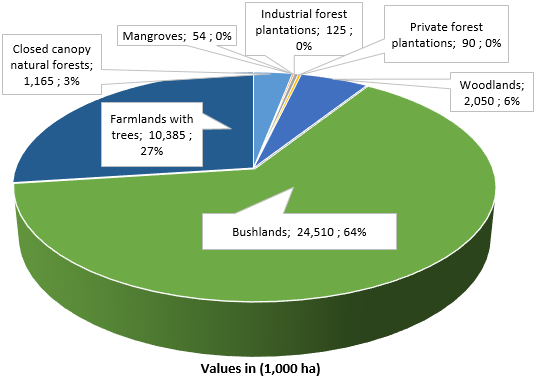
Most of the forest land in Kenya is under community and private ownership (77%) while the rest are under public (23%). Private plantations cover 47% of the total forest plantation area, which is almost equal to the area of stocked plantations under public management (53%)

Drivers of Deforestation and Degradation
Drivers of Deforestation and Degradation
Direct Drivers
- Inadequate application of basic silvicultural and ecological principles for forest management
- Tragedy of the commons resulting in conflicts over natural resources
Indirect Drivers
- Inadequate integration of the forest sector with other stakeholders
- Unclear forest responsibilities and weak conflict-management capacity
- Weak forest governance and institutions
- Corruption, illegal logging, weak enforcement
- Inadequate benefit sharing from forest resources
- Diverse perceptions of importance of forests
- Communal land tenure systems and their application
- Lack of private ownership, unclear tenure and access to forest resources
Direct Drivers
- Overgrazing and inadequate regulation of grazing in forest reserves and community lands
Indirect Drivers
- More focus shifted to water towers, paying less attention to dryland woodlands, including the coastal and riparian forests
Direct Drivers
- Clearing of forest for agriculture
- Degradation of forest
- Charcoal and fuel wood from unsustainable production
- Infrastructure and urbanisation
- Conversion of communal forest to agriculture
- Mining within forest areas
- Illegal logging
Indirect Drivers
- Demand is higher than supply
- Heavy bureaucracy and poor efficiency obstructing competitiveness
- Limited knowledge of tree growing (and necessary silviculture) as an enterprise
- Poverty, high prices for agriculture products, subsidised fertiliser, tax exemption for certain agricultural machinery resulting in unhealthy competition for land
- Fixed timber prices at low levels
- Rapidly increasing population has heightened the demand for land
- Few or no livelihood options have created over dependence on agriculture and mounting pressure on forest lands
Direct Drivers
- Poor uptake of new technologies
- Poor awareness of deforestation impacts
- Poor knowledge of tree planting
Indirect Drivers
- Uncertain availability of timber and wood for processing enterprises
- Low investment in wood processing resulting in ineffective processing
Direct Drivers
- Unsustainable utilisation, including overgrazing
- Conflict at multiple levels
- Fires are deliber ate, accidental, poorly managed and they destroy forests
- Wildlife damage impacting regeneration
Indirect Drivers
- Traditional farming methods in a context of increased population and overstocking of animals
Source: National Forest Programme 2016 - 2030
Ecosystem Types
Ecosystem Types
|
Ecosystem type |
Main regions |
|
High mountains |
Elgon, Kenya, Aberdares, |
|
Western plateau |
Kabarnet, Kakamega, Nandi |
|
Northern mountains |
Ndotos, Mathews, Leroghi, Kulal |
|
Coastal forests: |
Arabuko-Sokoke, Tana, Kayas, |
|
Southern hills |
Taita Hills, Kasigau, Shimba Hills, |
|
Riverine forests |
Tana and tributaries, Ewaso-Ngiro, |
Forest Estates
Forest Estates
Land use area changes in Kenya
Land use area changes in Kenya
|
Land use |
1990 |
2000 |
2005 |
2010 |
2015 |
|
Forest land |
4,724 |
3557 |
4,047 |
4230 |
4413 |
|
Crop land |
9,258 |
9661 |
9,868 |
10072 |
10276 |
|
Grassland |
41,522 |
41654 |
41,496 |
41080 |
40664 |
|
Settlement |
57 |
87 |
109 |
126 |
143 |
|
Other lands |
1,004 |
1574 |
1,035 |
1044 |
1053 |
|
Wetlands |
1,472 |
1504 |
1,482 |
1485 |
1488 |
|
Total area |
58,037 |
58,037 |
58,037 |
58,037 |
58,037 |
People and Economy
People and Economy
(a) Employment
18,000 people are directly employed by the forestry sector, according to 2011 FAO data.
(b) Economic Value
The forestry sector contributed USD 365.1 million to the economy in 2011, which is approximately 1.2% of the GDP.
Statistics of Saw Mill and Plywood Industries
Statistics of Saw Mill and Plywood Industries
The demand for building construction, furnishing and other end uses for forest products have grown faster than the supply from Kenya’s forests, resulting in an increase in net imports. The two main direct value addition industries from wood from Kenya’s forests are saw mills and plywood industries
|
Industry |
Number (2010) |
Capacity (2010) ('000m3) |
Consumption (2010) ('000m3) |
Demand (2020) ('000m3) |
|
Saw |
850 |
1000 |
855 |
1170 |
|
Plywood |
4 |
95 |
80 |
118 |
Total Forest Cover
Total Forest Cover
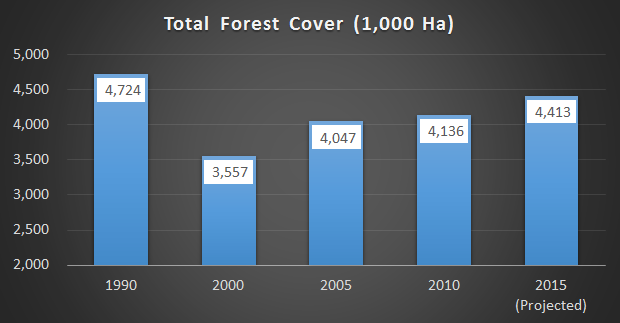
Between 1990 and 2000, Kenya lost approximately 1.2 million ha of forest land, equivalent to 25% of forest cover.
Quick Links
- National Strategies
- National Forest Reports
- Publications
- National Focal Points
- Laws and Policies
- Site Map
- Sign in / Sign Out
