- Home

- Monitoring

- State of Forests & REDD+

- Mozambique

- Mozambique National Indicators
Mozambique National Indicators
Mozambique Forest Indicators
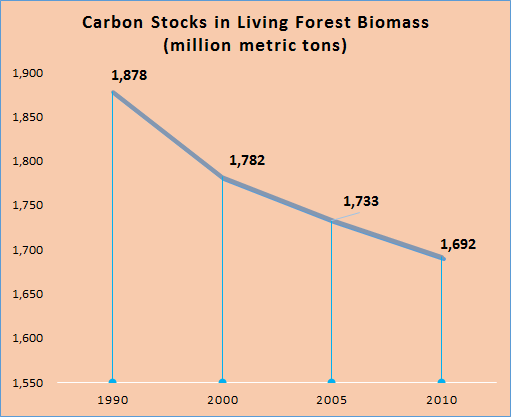
Carbon Stocks
Carbon Stocks
Drivers of Deforestation and Degradation
Drivers of Deforestation and Degradation
Agents and Indirect Causes
- Increased demand for agricultural products (tobacco, cotton, soybeans)
- Infrastructure expanding
- Political factors
Main degradation activities
- Selective wood cutting
- Firewood collection
- Hunting
- Pastures
- Fires
Main deforestation activities
- Large-scale production of sugarcane. producing vegetables, corn, soybeans, bananas
- Small scale agriculture in a Outgrowing-system cotton, cashew, tobacco
Results
- Deforestation for establishing the commercial agriculture and forest degradation
Agents and Indirect Causes
- Population Growth
- Increased domestic Demand for agricultural product
- Technological Development
Main degradation activities
- Selective wood cutting
- Firewood collection
- Hunting
- Pastures
- Fires
Main deforestation activities
- Shifting cultivation
- Yield crops
- Residential Areas
Results
- Deforestation for itinerant agriculture and Forest Degradation
Agents and Indirect Causes
- The increasing international demand for wood and its derivatives
- Political factors and governance
- Population growth
Main degradation activities
- Illegal logging
- Firewood collection
- Selective cutting
Main deforestation activities
- Forest concessions (native wood)
- Forest Plantations
Results
- Deforestation for or extraction of timber and products derivates and Forest Degradation
Agents and Indirect Causes
- Population Growth
- Infrastructure expansion
- Increased energy needs
Main degradation activities
- Firewood collection
- Coal Production
- Collection
Main deforestation activities
- Firewood collection and unsustainable charcoal production
- Expansion of housing and infrastructure areas
Results
- Deforestation by accumulation of impact over time collecting firewood and charcoal production and Forest Degradation
Agents and Indirect Causes
- Population Growth
- Economic Factors
- Migration urban rural areas
- Tourism
- Political Factors
Main degradation activities
Main deforestation activities
- Infrastructure expansion (eg roads, housing, tourist accommodation)
- Industry expanding
Results
- Deforestation for establishing urban Forest Degradation
Agents and Indirect Causes
- Increasing international demands for minerals
- Job search/migration
Main degradation activities
Main deforestation activities
- Mineral extraction
- Settlements in residential areas
- Infrastructure for exploration and flow
Results
- Deforestation related to mineral extraction Forest Degradation
Agents and Indirect Causes
- Standard increase in the local population consumption
- Animal products for domestic consumption
- Technological Development
Main degradation activities
- Pastures of small scale and in wooded areas
- Firewood Production
- Hunting
- Fires
Main deforestation activities
- Extensive grazing of cattle
Results
- Deforestation r elated to the creation of cattle, goats, swine, birds and Forest Degradation
Ecosystem Types
Ecosystem Types
|
Ecosystem type |
Provinces |
|
Mopane Forest
|
Gaza, Tete, Northern of Sofala & Manica Province |
|
Mecrusse Forest |
Inhambane, Gaza, Nampula & Sofala |
|
Mountainous Forest |
Zambezia, Mania & Niassa |
|
Mangoves Forest |
Along the wetlands of Coastal Area |
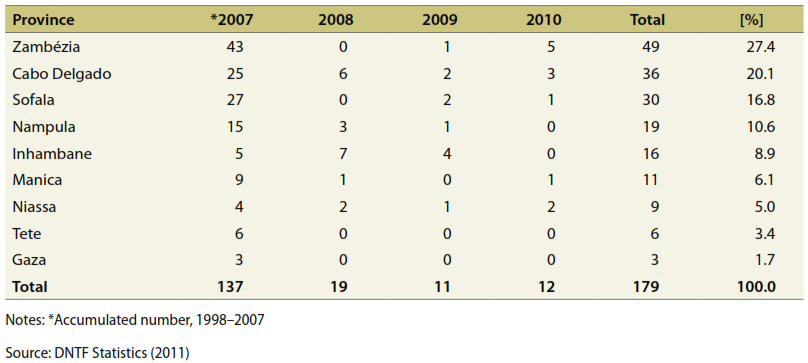
Forest Concessions Issued
Forest Concessions Issued
Number of forest concessions issued per year, 1998–2010
Forest classification based on usage
Forest classification based on usage
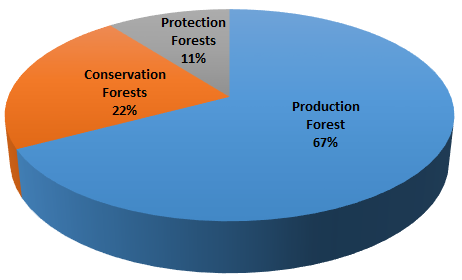
- Production Forests: 26.9 million ha
- Conservation Forests: 8.9 million ha
- Protection Forests: 4.2 million ha
People and Economy
People and Economy
(a) Employment
22 thousand people are directly employed by the forestry sector, according to 2011 FAO data.
(b) Economic Value
The forestry sector contributed USD 330.3 million to the economy in 2011, which is appoximately 2.8% of the GDP.
(c) Types of taxes by logging companies, annual revenues from 2012-2016
|
|
2012 |
2013 |
2014 |
2015 |
2016 |
|
Total in Mts
|
319.024.593
|
468.506446
|
572.970.033
|
347.057.986
|
446.037.024
|
|
Total in USD
|
4.519.402,08
|
6.637.008,73
|
8.116.872,54
|
4.916.531,89
|
6.318.699,87
|
Conversion rate USD$ 1 = 70.59 Mts
Statistics Derived from Forest Cover Map of 2007
Statistics Derived from Forest Cover Map of 2007
|
Province |
Total Area [km²] |
Closed Forest Area |
Open Forest Area |
Agriculture w/trees Area |
Shifting Cultivation Area |
|
Manica |
62,200 |
16,021.60 |
18,538.80 |
4,075.50 |
11784,3 |
|
Maputo |
26,964 |
2,986.60 |
5,164.20 |
|
|
|
Cabo Degaldo |
76,820 |
32,953.20 |
14,582.00 |
4,312.60 |
6633,5 |
|
Gaza |
77,040 |
16,959.80 |
20,749.40 |
18,309.50 |
1847,9 |
|
Nampula |
|
18,280.40 |
8,630.10 |
3,752.50 |
5074,8 |
|
Niassa |
127,760 |
57,865.10 |
363415.3 |
6403.6 |
3,430.90 |
|
Sofala |
68,712 |
8,538.30 |
19,958.50 |
7,791.30 |
9,373.20 |
|
Tete |
100,088 |
19,659.10 |
22,407.70 |
18,798.00 |
5,428.60 |
|
Inhambane |
67,260 |
10,999.40 |
12,057.30 |
16,466.50 |
8,566.30 |
|
Zambesia |
101,284 |
43,011.40 |
5,467.10 |
8,089.10 |
15,369.50 |
|
Total |
|
227,274.80 |
163,900.30 |
87,998.60 |
67,509.00 |
Timber Production
Timber Production
|
Product Type |
Unit |
2010 |
2011 |
2012 |
2013 |
2014 |
2015 |
Total |
Main Destination |
|
Logs |
m3 |
22,846 |
35,426 |
41,543 |
54,296 |
147,517 |
148,093 |
449,721 |
China |
|
Sawn Wood |
m3 |
175,491.52 |
175,982 |
218,842 |
226,500 |
373,769 |
272,858 |
1,443,443 |
China, UK |
|
Parquet (m3) |
m2 |
542.25 |
109 |
49 |
15 |
169 |
1,891 |
2,776 |
China, South Africa, UK |
|
Veneer (m2) |
m2 |
119.09 |
102 |
79 |
81 |
129 |
97 |
607 |
China |
|
Sleepers (m3) |
m3 |
1,041.37 |
1,657 |
1,998 |
1,062 |
1,092 |
806 |
7,655 |
China, South Africa, Malawi |
|
Wood panels |
- |
- |
36 |
55 |
9 |
20 |
120 |
China |
|
|
Bamboo |
st |
- |
- |
307 |
- |
- |
- |
307 |
China |
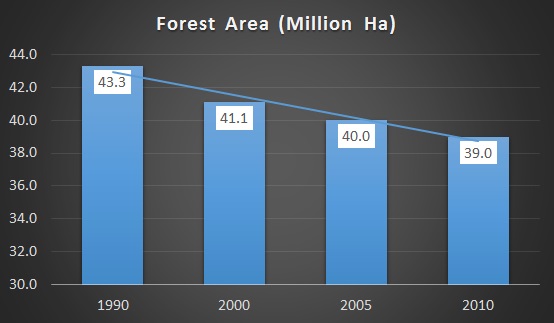
Total Forest Cover
Total Forest Cover
Between 1990 and 2010 Mozambique lost 10.0% of its forest cover, around 4,356,000 ha, whereby the average loss per year is 217,800 ha.
Quick Links
- National Strategies
- National Forest Reports
- Publications
- National Focal Points
- Laws and Policies
- Site Map
- Sign in / Sign Out
